zxsp Featuresfeatures a Debuggerdebugger with disassembler, Debugger: Breakpointsbreakpoints Done: 2000 – 0.1.8 and 0.2.2and single stepper. Additionally you can load Assemblerassembler sources for Snapshotssnapshots directly with the 'Open' menu command.
Registers
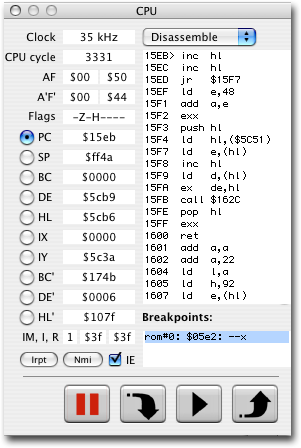 In the windows menu you find a panel for the Snapshots: .Z80Z80 central processing unit (cpu). This is the central panel for the Debuggerdebugger. If you want to cancel editing, just enter empty data.
Clock
Throttle down the cpu to any speed Done: 2000 – 0.1.8 and 0.2.2and watch it running in the Debugger: Memory view
Memory view: Memory viewmemory view. Setting the ULA control panel: CPU clockcpu clock set's the speed for the whole machine. A running program cannot detect this.
CPU cycle
This field shows the current Registers: CPU cyclecpu cycle since last interrupt. With the information about total cpu Video signals: Frames per secondcycles per interrupt, in-screen start Done: 2000 – 0.1.8 and 0.2.2and end cycle you know how many time is left until the next interrupt or whether writing into the screen will be displayed still this frame or not until the next frame. The Sound: AY control panelay panel Done: 2000 – 0.1.8 and 0.2.2and the video beam indicator are helpful in this case too.
If the machine is halted then you can edit this field. Then the cpu will run up to the entered cycle. If the value is smaller than the current cycle, then it will run up to this cycle in the next frame. This way you may quickly advance to a certain video beam position, where you want to see whether your program is fast enough to write to this screen position before it is displayed.
AF ... HL'
These fields display the current values of the Snapshots: .Z80z80 Debugger: Registersregisters. They may be changed even while running, but then you should better know which register is not used in your program.
The values are shown in hex, so that the double Debugger: Registersregisters easily form a 16 bit value for reading. When you set a register, you may enter the value in decimal or hex.
Flags
In addition to the hex value the currently used Registers: Flagsflags are also displayed with their named bits. To set or clear a Registers: Flagsflag, add it's name or remove it from the visual Registers: Flagsflags display field. The name is important, not the position where you put it in.
IM, I, R
These 3 fields display Done: 2000 – 0.1.8 and 0.2.2and set the values for the interrupt mode, im 2 interrupt table high byte Done: 2000 – 0.1.8 and 0.2.2and refresh register.
Irpt, NMI, IE
Clicking on a button triggers the according interrupt. When the machine is halted, you also have the chance to clear a pending interrupt. In the control menu there are also menu items for a power-on or a simple push button reset Done: 2000 – 0.1.8 and 0.2.2and an NMI interrupt.
The IE Registers: Flagsflag represents the iff1 interrupt enable flip flop. Using this Registers: Flagsflag you can simplify debugging with a simple trick: Insert 'di' Done: 2000 – 0.1.8 and 0.2.2and 'Single stepping: Pause buttonhalt' at a position into your source where you want to stop your program, load Done: 2000 – 0.1.8 and 0.2.2and run the source Done: 2000 – 0.1.8 and 0.2.2and when the cpu hogs on 'Single stepping: Pause buttonhalt' Single stepping: Pause buttonhalt the machine, enable interrupts (or increment the pc) und resume using the single stepper.
Memory view
Radio buttons
The Memory view: Radio buttonsradio buttons left of the Debugger: Registersregisters select which register should be used as base address for the Debugger: Memory view
Memory view: Memory viewmemory view.
Popup
The Memory view: Popuppopup over the Debugger: Memory view
Memory view: Memory viewmemory view lets you choose how the memory contents should be presented:
- Disassemble. This Tape recorder: Optionsoption is automatically selected, when you select the pc as address base. The memory is disassembled.
- Hexdump. This is the default for all To Do: other:other register. The memory is displayed in a compact manner using hexadecimal bytes.
- Decimal bytes. Similarly the memory is displayed in decimal representation using bytes.
- Decimal words. As above but as 2-byte words.
- Textual. Use this mode to display ranges of memory which are supposed to contain printable text.
Memory view
The Debugger: Memory view
Memory view: Memory viewmemory view itself display approx. 20 lines of disassembly or raw data. The display is switched on when you Single stepping: Pause buttonhalt the machine for Debugger: Single steppingsingle stepping or lower the ULA control panel: CPU clockcpu clock below 100 Hz. Then you can watch the cpu plowing through the code.
Scrolling Done: 2000 – 0.1.8 and 0.2.2and editing memory contents is not yet implemented. (as of Done: 2008-05-26 - Version 0.7.2
Done: 2007-07-28 - Version 0.7.1
Done: 2007-05-13 - Version 0.7.0
Done: 2007-05-01 - Version 0.6.7.1
Done: 2007-03-29 - Version 0.6.6
Done: 2006-11-18 - Version 0.6.5
Done: 2005-01-16 - Version 0.6.2
Done: 2004-11-26 - Version 0.6.1version 0.6.2)
Breakpoints
The Debugger: Breakpointsbreakpoint view allows you to set Debugger: Breakpointsbreakpoints. These Debugger: Breakpointsbreakpoints are not visible to the running program; e.g. they are not a RST opcode as would be required for a native Debuggerdebugger. Debugger: BreakpointsBreakpoints can be set for execution Done: 2000 – 0.1.8 and 0.2.2and also for read Done: 2000 – 0.1.8 and 0.2.2and write access.
One special Debugger: Breakpointsbreakpoint can be set from the Tape recorder: Optionsoptions menu: 'Single stepping: Pause buttonHalt Cpu after Block Loaded' sets a Debugger: Breakpointsbreakpoint at the end of the Snapshots: .TAPtape load routine in Snapshots: .ROM
MMU registers for the +128K / +2: ROM $0000rom. The panel reproduced above shows this Debugger: Breakpointsbreakpoint.
To enter a Debugger: Breakpointsbreakpoint simply enter a new line with the desired address. By default this adds a Debugger: Breakpointsbreakpoint for execution, indicated with an 'x' if you specify no To Do: other:other condition. You may also set Debugger: Breakpointsbreakpoints which Single stepping: Pause buttonhalt program execution for memory reading or writing for certain addresses, appending 'r' or 'w' to the address instead of 'x'.
The Debugger: Breakpointsbreakpoint display also starts with an information, in which page the Debugger: Breakpointsbreakpoint lies, in the above example this is Snapshots: .ROM
MMU registers for the +128K / +2: ROM $0000rom number 0, obviously a 48k machine. Else it would have been Snapshots: .ROM
MMU registers for the +128K / +2: ROM $0000rom 1. If the traced memory cell is paged out of the cpu's address page, then the page Done: 2000 – 0.1.8 and 0.2.2and address information are still valid, only the two high bits of the address are of no interest Done: 2000 – 0.1.8 and 0.2.2and are set to default values. ($0000 for Snapshots: .ROM
MMU registers for the +128K / +2: ROM $0000roms Done: 2000 – 0.1.8 and 0.2.2and $C000 for MMU registers for the +128K / +2: RAM $8000
MMU registers for the +128K / +2: RAM $4000
MMU registers for the +3 / +2A: RAM $8000
MMU registers for the +3 / +2A: RAM $4000ram pages) Debugger: BreakpointsBreakpoints refer to memory cells, not to cpu addresses. This is a great advantage with paged memory Done: 2000 – 0.1.8 and 0.2.2and is especially good, as some pages may be visible twice in the cpu's address space.
If you enter a Debugger: Breakpointsbreakpoint with MMU registers for the +128K / +2: RAM $8000
MMU registers for the +128K / +2: RAM $4000
MMU registers for the +3 / +2A: RAM $8000
MMU registers for the +3 / +2A: RAM $4000ram or Snapshots: .ROM
MMU registers for the +128K / +2: ROM $0000rom number, then the address is taken module page size, that is, the two upper bits of the address are ignored. So you may enter the visible address or the address inside the page at your choice.
note: Currently it is hard to remove the last Debugger: Breakpointsbreakpoint, because clearing an input field cancels input. If you want to clear all Debugger: Breakpointsbreakpoints clear the Debugger: Breakpointsbreakpoints field Done: 2000 – 0.1.8 and 0.2.2and enter a single space. (Done: 2008-05-26 - Version 0.7.2
Done: 2007-07-28 - Version 0.7.1
Done: 2007-05-13 - Version 0.7.0
Done: 2007-05-01 - Version 0.6.7.1
Done: 2007-03-29 - Version 0.6.6
Done: 2006-11-18 - Version 0.6.5
Done: 2005-01-16 - Version 0.6.2
Done: 2004-11-26 - Version 0.6.1version 0.6.2)
Single stepping
Pause button
The Single stepping: Pause buttonpause button Single stepping: Pause buttonhalts or resumes the machine. The single stepper buttons become active when the machine is halted.
You may also use the menu entry in the Tape recorder: Optionsoptions menu or, supposedly, the menu shortcut for this purpose.
Step in button
This button Pause button: Step over buttonsteps over a simple instruction as the Pause button: Step over buttonstep over button does. But in case of 'call' Done: 2000 – 0.1.8 and 0.2.2and 'rst' it steps into the subroutine. Block instructions are executed byte by byte Done: 2000 – 0.1.8 and 0.2.2and 'Single stepping: Pause buttonhalt' only executes once.
Step over button
This button Pause button: Step over buttonsteps over a simple instruction as the Pause button: Step in buttonstep in button does. But it Pause button: Step over buttonsteps over subroutine calls, block instructions Done: 2000 – 0.1.8 and 0.2.2and 'Single stepping: Pause buttonhalt' in one go. In case of a subroutine call it enters the soubroutine Done: 2000 – 0.1.8 and 0.2.2and sets a stack marker like Pause button: Step out buttonstep out does. Pause button: Step over buttonStep over also detects when block instructions overwrite themself or are overwritten or paged out by interrupt code Done: 2000 – 0.1.8 and 0.2.2and stop. 'Single stepping: Pause buttonHalt' stops at the next interrupt even if interrupts are disabled.
Stepping over a subroutine call may stop prematurely if the stack is manipulated, namely if the subroutine pops the return address.
Step out button
This button sets a stack marker Done: 2000 – 0.1.8 and 0.2.2and runs until a 'ret', 'pop' or 'ex (sp),hl' instruction pops the marked address from the return stack. For this reason Pause button: Step out buttonstep out also stops at the next unbalanced 'pop' Done: 2000 – 0.1.8 and 0.2.2and it won't stop if the stack is repositioned Done: 2000 – 0.1.8 and 0.2.2and the marked address is never encountered.